Author : Haya Assem
Reviewed By : Enerpize Team
What Is the Comparative Balance Sheet: A Comprehensive Guide
Table of contents:
- What is a Comparative Balance Sheet?
- What Does a Comparative Balance Sheet Contain?
- How Does Comparative Balance Sheet Work?
- Importance of Comparative Balance Sheet
- Comparative Balance Sheet Format
- Comparative Balance Sheet Example
- How to Calculate Percentage in Comparative Balance Sheet
- How Can Enerpize Help in Comparative Balance Sheet?
A Comparative Balance Sheet is a powerful financial tool that allows companies to track their performance over two different financial periods. By comparing assets, liabilities, and equity from different reporting years, companies can accurately evaluate their financial state. This guide explores how a comparative balance sheet works, its components, format, and importance.
Key Takeaways
- A comparative balance sheet presents assets, liabilities, and equity side-by-side across two or more periods, enabling clear financial trend analysis.
- Comparative balance sheet helps identify increases or decreases in line items over time, providing insights into business performance and financial positioning.
- Common components include current assets, non-current assets, current liabilities, long-term liabilities, and equity for each period compared.
- Percentage-change columns enhance the format by quantifying growth or decline, aiding quick interpretation.
- The comparative format supports pattern spotting, compliance, stakeholder confidence, and strategic decision-making.
What is a Comparative Balance Sheet?
A comparative balance sheet is one of several financial statements that show a company's financial situation over different periods. This financial statement format streamlines the process of comparing two financial periods, allowing stakeholders to track performance over time and identify trends, improvements, or potential issues.
Read Also: What is a Balance Sheet for Small Business?
What Does a Comparative Balance Sheet Contain?
A comparative balance sheet contains detailed information on the company's assets, liabilities, and equity for each period, allowing for easy comparison and analysis of financial trends. This side-by-side comparison format helps businesses and stakeholders track progress, assess growth, and make informed financial decisions.
- Assets: Includes both current assets (like cash, accounts receivable, and inventory) and non-current assets (such as property, equipment, and investments).
- Liabilities: Divided into current liabilities (such as accounts payable and short-term debts) and long term liabilities (including loans and bonds).
- Equity: Represents the owner's equity or shareholders' equity, including retained earnings and common stock.
How Does Comparative Balance Sheet Work?
A comparative balance sheet allows businesses to compare their financial position over different periods easily. By analyzing changes in assets, liabilities, and equity, companies can identify trends, make informed decisions, and better understand their financial performance.
Choose the Reporting Periods
The first step in creating a comparative balance sheet is to specify the periods for comparison. Companies often compare their balance sheets at the end of two consecutive financial years, but quarterly comparisons can provide more detailed data.
List the Assets for Each Period
The next step is to list the company's assets for each reporting period. Assets include both current and non-current items, such as cash, accounts receivable, inventory, and property. Presenting each period's assets makes it easier to identify an increase or decline in the company's resources.
Read Also: What is the Difference Between Liquid and Illiquid Assets?
Calculate the Percentage Change
Once you’ve listed the assets, calculate the percentage change for each item by comparing the values between periods. This step is critical as it provides a clearer picture of how much the company’s assets have increased or decreased.
List the Liabilities and Equity for Each Period
You’ll also need to present liabilities (short-term and long-term obligations) and equity for each period. This section helps identify changes in the company's financial obligations, such as outstanding loans, and any shifts in owners’ equity over time.
Calculate Percentage Change for Liabilities and Equity
Calculating the percentage change in liabilities and equity will provide a clearer understanding of how the company's financial condition has changed. This percentage allows for easy comparisons to determine if liabilities are growing too fast, or if equity is constantly increasing.
Read also: How to Calculate Liabilities
Ensure Accuracy
After listing the data and calculating changes, it’s essential to review all entries for accuracy. Errors in the balance sheet might result in inaccurate interpretations and misguided business decisions.

Importance of Comparative Balance Sheet
The comparative balance sheet is essential for assessing a company's financial health over time. It enables the detection of financial patterns and performance trends, supports business owners in making informed decisions, and helps build investor trust. Also, it promotes compliance and transparency, making it a valuable tool for both internal and external stakeholders.
- Trend Identification: By comparing various periods, companies can identify patterns, such as increased assets or growing liabilities, that may indicate growth or potential risks.
- Performance Evaluation: It enables stakeholders to assess how well the company manages its resources, debts, and equity over time, providing insights into operational efficiency and financial stability.
- Informed Decision-Making: The ability to track financial changes allows businesses to make better decisions on investments, expenses, and future growth strategies.
- Investor Confidence: Comparative balance sheets provide investors with clear, comprehensive information to analyze the company's financial path, making it easier to assess the risks and rewards of their investments.
- Compliance and Transparency: Presenting financial data in a comparable format promotes transparency and confidence among shareholders, regulators, and other stakeholders.
Comparative Balance Sheet Format
| Accounts | Previous Year | Current Year | Absolute Change |
| Assets | |||
| Fixed Assets | xxx | xxx | xx |
| Current Assets | xxx | xxx | xx |
| Accounts Receivable | xxx | xxx | xx |
| Total Assets | xxx | xxx | xx |
| Liabilities | |||
| Current Liabilities | xxx | xxx | xx |
| Account Payable | xxx | xxx | xx |
| Total Liabilities | xxx | xxx | xx |
| Owner’s Equity | xxx | xxx | xx |
A Comparative Balance Sheet is often presented in a side-by-side form, comparing a company's financial status across two different periods, usually the current and previous year. This format helps users quickly identify changes in assets, liabilities, and equity. Businesses that include a column for the difference between the two years may quickly observe trends and make better-informed decisions.
First Column: Accounts and Items
This column lists all the accounts found on a standard balance sheet. The items are organized into Assets, Liabilities, and Equity categories. Under Assets, you would include inventory, cash, and accounts receivable items. For Liabilities, you’d list debt and accounts payable items, while Equity would include retained earnings and other capital-related items.
Second Column: Previous Year’s Figures (YYYY-1)
Records last year’s figures to provide a baseline for comparison. This helps track changes in specific accounts over time.
Third Column: Current Year’s Figures (YYYY)
Records the current year’s data, showing the most recent financial figures for each account.
Fourth Column: Change (Difference Between the Two Years)
This final column calculates the difference between the previous year’s and the current year’s figures for each account. The change is usually shown as a positive or negative figure to indicate whether the account has increased or decreased.
Read Also: How to Calculate Retained Earnings on A Balance Sheet
Comparative Balance Sheet Example
A Company is reviewing its financial position at the end of 2023 and comparing it with 2022. Over the past year, the company focused on increasing sales and reducing debt. As a result:
| Account | 2023 | 2024 | Change |
| Assets | |||
| Cash | 25,000 | 30,000 | +5,000 |
| Accounts Receivable | 12,000 | 15,000 | +3,000 |
| Inventory | 18,000 | 20,000 | +2,000 |
| Total Assets | 55,000 | 65,000 | +10,000 |
| Liabilities | |||
| Accounts Payable | 10,000 | 8,000 | -2,000 |
| Debt | 20,000 | 15,000 | -5,000 |
| Total Liabilities | 30,000 | 23,000 | -7,000 |
| Equity | |||
| Retained Earnings | 25,000 | 42,000 | +17,000 |
| Total Equity | 25,000 | 42,000 | +17,000 |
| Total Liabilities & Equity | 55,000 | 65,000 | +10,000 |
Assets:
- Cash increased by $5,000 due to higher revenue.
- Accounts Receivable rose by $3,000, reflecting more outstanding payments from customers.
- Inventory grew by $2,000, as the company stocked up to meet higher demand.
Liabilities:
- Accounts Payable decreased by $2,000, and the company paid down Debt by $5,000, reducing its total liabilities.
Equity:
- The company retained $17,000 more in earnings, reflecting its stronger financial performance.
This shows that the company is growing its assets while reducing liabilities, leading to a healthier financial position.
Find Here: Free Balance Sheet Template for Small Business
How to Calculate Percentage in Comparative Balance Sheet
To calculate the percentage change in a comparative balance sheet, you typically compare the values of each item from two different periods and express the difference as a percentage.
Formula:
Formula Breakdown:
- Find the difference: Subtract the previous year’s value from the current year’s value.
- Divide by the previous year’s value: This gives you the proportion of change.
- Multiply by 100: Convert the proportion into a percentage.
Read Also: Comparative Income Statement: Importance & Preparation
How Can Enerpize Help in Comparative Balance Sheet?
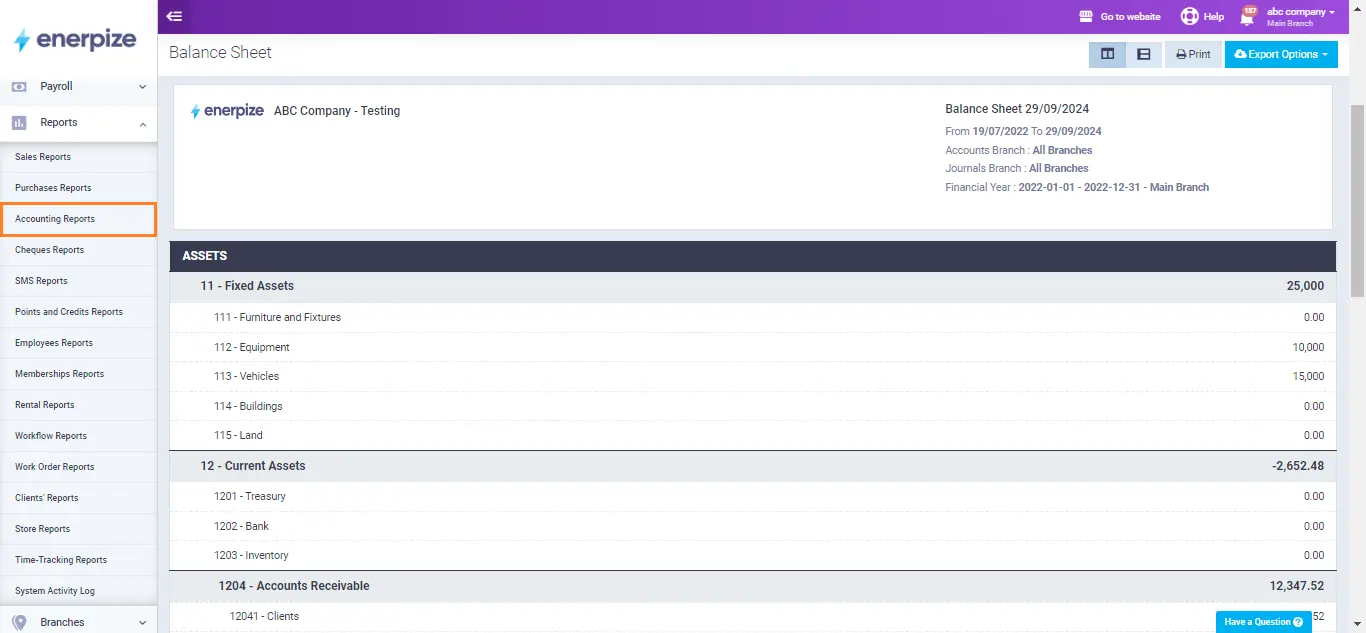
Enerpize enhances the process of creating a Comparative Balance Sheet by automating financial report generation and allowing users to easily access historical data for year-to-year comparisons. The Enerpize online accounting software streamlines the process through automated data entry, real-time access to financial information, and standardized reporting formats.
Also, Enerpize enables users to set the financial years they need to compare, automatically expanding each year’s data accurately. This feature simplifies the process of generating a Comparative Balance Sheet by ensuring that the correct figures are aligned for comparison, enhancing the overall accuracy of financial reporting.
Comparative balance sheet is easy with Enerpize.

Try our accounting module to track business performance.
Comparative balance sheet is easy with Enerpize.
Try our accounting module to track business performance.