![<?$related_template['Template']['title'];?>](/files/business_templates/cash_flow_statement_template.webp)
![<?$related_template['Template']['title'];?>](/files/business_templates/discounted_cash_flow_template.webp)
![<?$related_template['Template']['title'];?>](/files/business_templates/commercial_invoice_template.webp)
![<?$related_template['Template']['title'];?>](/files/business_templates/3_statement_model_template.webp)
![<?$related_template['Template']['title'];?>](/files/business_templates/export_commercial_invoice_template.webp)
![<?$related_template['Template']['title'];?>](/files/business_templates/proforma_invoice_template1.webp)
![<?$related_template['Template']['title'];?>](/files/business_templates/bank_reconciliation.webp)
![<?$related_template['Template']['title'];?>](/files/business_templates/trial_balance.webp)
![<?$related_template['Template']['title'];?>](/files/business_templates/balance_sheet_template.webp)
Create and send online quotations and invoices, track sales, monitor staff performance, and sell & sync all your products via our POS and more.
Posted on 17 March 2025
Break Even Analysis Template Excel & Google Sheets
- The break-even analysis template is available in Excel and Google Sheets.
- It's a practical tool to help businesses determine the sales volume needed to cover costs and achieve profitability.
- Used for setting optimal pricing, managing expenses, and confidently making data-driven investment decisions.
- Empowers businesses with financial clarity, enabling smarter planning, risk reduction, and sustainable growth strategies.
Download it from here:


What is The Break Even Analysis Template?
A Break-Even Analysis Template is a financial tool that helps businesses determine the exact point at which revenue generated matches total costs, ensuring neither profit nor loss. It's critical for assessing the feasibility of launching new products, setting prices, and making investment decisions. It also simplifies the process by structuring fixed and variable costs, projected sales, and pricing models into a clear framework. By using a break-even analysis template, businesses gain a data-driven approach to understanding their financial position, minimizing risks, and setting realistic revenue goals.
Importance of Break-Even Analysis Template
Confirms Financial Viability:
Understanding the break-even point is essential for assessing whether a product or service can sustain itself financially. By calculating how much revenue is required to cover total costs, businesses can determine if their venture is realistic and achievable. This insight is particularly valuable for startups, new product launches, or expansion plans, as it helps prevent premature financial losses. With a clear picture of financial sustainability, businesses can make informed go/no-go decisions and allocate resources more efficiently.
Guides Pricing Strategies:
Setting the right price is crucial for profitability, and break-even analysis plays a key role in this process. By evaluating how different price points impact revenue and costs, businesses can establish pricing strategies that ensure profitability while remaining competitive. Whether adjusting for market conditions, cost fluctuations, or competitor pricing, this analysis enables businesses to find a pricing sweet spot that maximizes revenue, attracts customers, and maintains a healthy profit margin.
Identifies Cost Management Opportunities:
A break-even analysis template provides a structured view of all fixed and variable costs, making it easier to pinpoint inefficiencies and unnecessary expenditures. By identifying areas where costs can be reduced without compromising quality, businesses can improve profit margins and enhance operational efficiency. This approach is especially useful in cost-cutting initiatives, budgeting strategies, and financial planning, as it ensures that businesses operate within sustainable cost structures while maximizing profitability.
Aids in Investment Decisions:
Before allocating funds to a new project, product, or expansion, businesses need to evaluate its financial feasibility. A break-even analysis minimizes the risk of investment failures by providing a clear understanding of the required sales volume and potential profitability. Investors and stakeholders also rely on break-even data to assess the viability of funding a business, making it a critical tool for securing investments and ensuring smart capital allocation.
Supports Sales and Revenue Planning:
Knowing the break-even point allows businesses to set realistic sales targets and revenue goals. Sales teams can use this information to develop performance benchmarks, track progress, and adjust strategies to align with financial objectives. Additionally, businesses can use break-even data to model different sales scenarios, helping them plan for seasonal fluctuations, market shifts, and growth opportunities. This ensures that revenue strategies are both achievable and sustainable.
Who Can Use Break Even Analysis Template?
Small and Medium-Sized Enterprises (SMEs):
SMEs often operate on tight budgets, making it crucial to assess the profitability of new ventures before committing resources. A break-even analysis ensures they have a clear strategy for covering costs and achieving sustainable growth.
Startups:
New businesses can benefit from a break-even analysis to determine whether their business model is financially viable. It also helps in securing funding by providing potential investors with a clear roadmap to profitability.
Large Corporations:
Even established businesses use break-even analysis to evaluate the profitability of new product lines or market expansions. This helps in making strategic financial decisions and optimizing operational efficiency.
Freelancers and Consultants:
Independent professionals can use a break-even analysis to set appropriate rates for their services, ensuring they cover expenses while maintaining profitability.
Retailers and Manufacturers:
Businesses dealing with physical products can use the template to determine pricing, production levels, and cost structures that maximize profit margins.
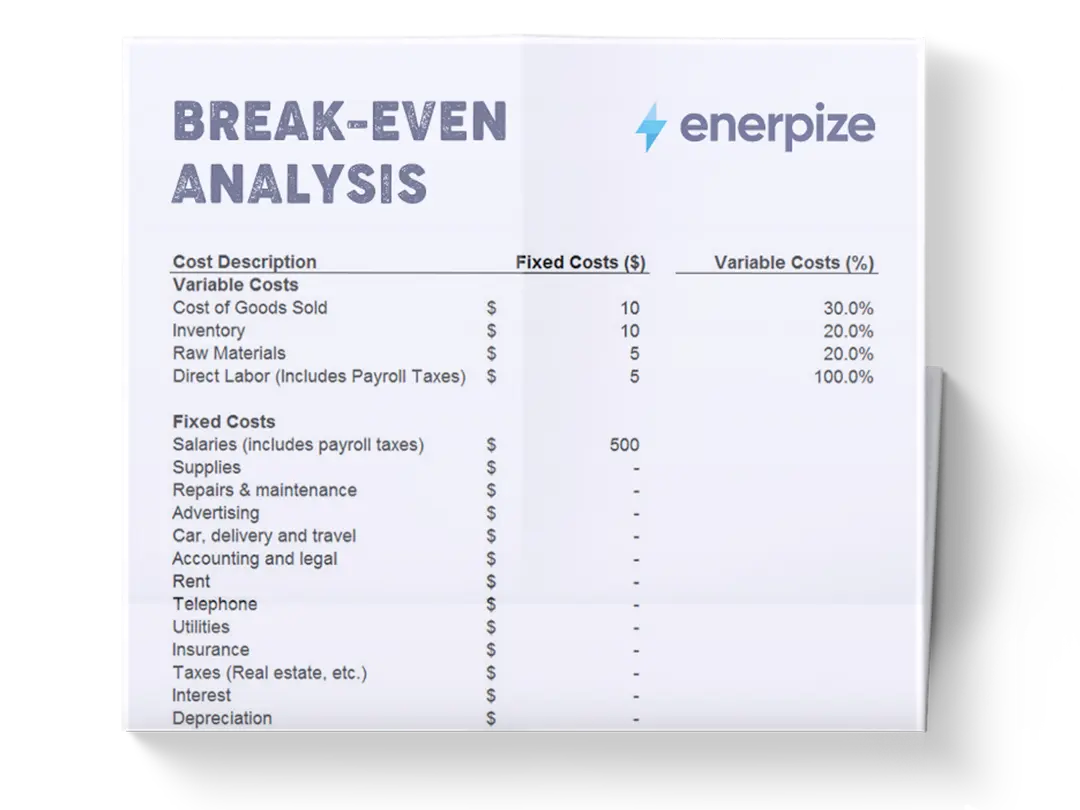
What Does The Break Even Analysis Template Contain?
1- Variable Costs (Per Unit)
These are costs that change with production levels, including:
- Cost of Goods Sold (COGS)
- Labor costs
- Overhead expenses
- Other variable costs
2- Fixed Costs
These are ongoing business expenses that remain constant regardless of production levels:
- Advertising
- Legal fees
- Rent
- Supplies
- Interest expenses
- Manufacturing costs
- Taxes
- Utilities
3- Selling Price Per Unit
The amount at which each unit of the product or service is sold to customers.
4- Total Variable Cost (Per Unit)
The sum of all variable costs per unit, calculated to assess profitability per unit sold.
5- Contribution Margin (Per Unit)
The difference between the selling price and total variable cost per unit represents the profit contribution per unit before covering fixed costs.
6- Contribution Margin Ratio
A percentage indicating how much of each sales dollar contributes to covering fixed costs and generating profit.
7- Break-Even Units
The number of units that must be sold to cover total costs, ensuring neither profit nor loss.
8- Break-Even Sales
The total revenue required to reach the break-even point ensures full cost recovery.
How to Use Break-Even Analysis Template
1. Gather Financial Data
Collect details about fixed costs (rent, utilities, salaries) and variable costs (materials, labor, overhead) to ensure accurate calculations. This step is crucial as accurate data will enhance the reliability of your break-even analysis.
2. Input Costs into the Template
Enter fixed and variable costs into their respective sections to get a clear breakdown of expenses. Ensuring precise input helps in minimizing errors and obtaining a reliable analysis.
3. Define Selling Price Per Unit
Determine the selling price for your product or service to evaluate profitability and market competitiveness. Consider market trends, competitor pricing, and consumer demand when setting a price point.
4. Calculate Contribution Margin
Subtract variable costs from the selling price to find out how much profit each unit contributes before covering fixed costs. This margin is key in assessing your overall profitability potential.
5. Determine Break-Even Point
Use the formula: Break-Even Units = Total Fixed Costs / Contribution Margin Per Unit This tells you the number of units you need to sell to break even. Analyzing this figure helps in understanding how long it will take to cover costs and start generating profits.
6. Analyze Break-Even Sales
Multiply break-even units by the selling price to determine the revenue required to cover all expenses. This step gives you a concrete financial target to work toward.
7. Adjust and Optimize
Experiment with different pricing strategies, cost reductions, or sales volume adjustments to improve profitability and financial sustainability. Regularly revisiting and updating your break-even analysis ensures it remains relevant as market conditions change. You can also use it as a benchmark to track financial performance and adjust business strategies accordingly.